6.2. Sourcing and access
Knowledge artefact source types, and levels of external (to the organisation) access for user organisations and for providers, are examined initially in this section. Then, the internal access (within a site) of knowledge artefacts is related to the knowledge artefact characteristics and performance. The knowledge artefact sources were rated by participants from most used (1) to least used (7). They are categorised in:
• internal sourcing: created within the organisation (IC), recruitment of expert (IR);
• cross-boundary sourcing: co-created with other organisations (CBCC), adaption with minimal changes of existing best practice from other organisations or habi-tats (CBA); or
• external: from sector support (ESS), or specific commission or purchase (EC).
The order of all sources is shown in Table 6 14. The most used source was Internal-ly created. The Other option was used by three sites, mainly to show internet use.
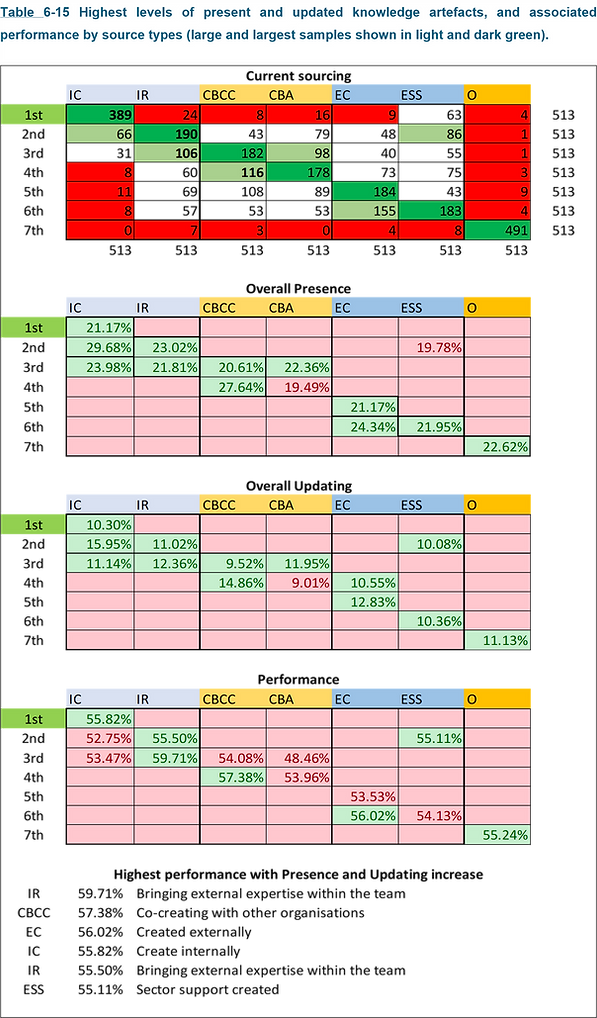
The above source combination related to the research’s average presence (20.26%), updated rate (9.51%) and performance (54.97%). Is this, however, the most beneficial order of selecting sources? By examining the answers with large enough samples (shown in green and light green in current sourcing, top of Table 6 15), the presence, updating, and performance related to each source was calculated at higher or lower selection levels. At the bottom of Table 6 15 it is shown that the highest performance that also relates to increase in knowledge artefact presence and updating, is by selecting IR (internally sourced by recruiting an expert), then CCBC (co-creating with other organisations) and so on. CBA (adaption with minimal chang-es) which could be considered as an easy option to use, does not come up in the top six best sources. Is sourcing of such almost-ready to adapt knowledge artefacts very difficult in practice?
Furthermore, the most effective order is not universal. It is possible, for example. to rate the effectiveness of the current source order for each habitat. In Table 6 16, values near 0 had the best source order suitability selected by the participants. Negative figures show reduced knowledge artefact presence and updating, and reduced performance. Positive numbers show increased performance but reduced present or updated knowledge artefacts, so potentially unsustainable knowledge management.
Extensively modelling several sourcing combinations showed that not choosing the two internal creation source options (IC and IR) within the top three sourcing options, related to significant reduction in performance. Two combinations showed significantly higher performance and high levels of knowledge artefacts (Table 6 17).
Model (a) was used by 21 participating sites. In model (a), the presence and updating rate were very high, with a performance of 71.38% (30% performance in-crease). Alongside a high use of sector support as a source, the model relied heavily on internal sourcing by creating inhouse and by recruiting a specialist. This approach has business plan and policy implications. Is the improvement high enough to cover the cost of employing the specialist? Potentially yes, as not only the overall performance is high, but also the Economic development is as high as seen across the demographic contingencies, at 72.37% (68% increase on the Economic development objective’s average performance). This would then indicate a beneficial policy of employing specialists on long term or permanent contracts, rather than bringing them in as consultants on short-term grant funded projects. In this model, the conversion of present to updated knowledge artefacts is very high, 61.16%. So, in model (a), the high level of knowledge artefacts is maintained, potentially making the high performance more sustained.
Model (b) was used by three of the participating sites. Presence of knowledge artefacts was over double compared to model (a), but the updated level was almost half of model (a); the conversion rate in model (b) was only 16.27%. It appears then highly bureaucratic, in as far as having lots of knowledge artefacts, but only one in six of those being up to date. The sourcing initially relied on the same two internal creation types, but then opted for external commissioning, with both sector support and cross-boundary adaption being lower down the order. The performance was even higher, at 87.50% (being mindful of the small sample in this) but the management ap-pears unsustainable, overloaded with out-of-date knowledge.
The knowledge curating design could aim to find a model that has the benefits of these two models, but not the shortfalls. In model (a) the performance could improve by utilising learnings from other demographic contingencies, particularly for improving Cultural education which is the weakest objective in model (a). But ensuring the excellent conversion rate is maintained. Model (b) raised the question, why do sector support provided, and cross-boundary created sources, appear ineffective? If the design can improve their effectiveness, and the means to easier convert present to updated knowledge artefacts, then the model (b) performance would be more sustained.
In both models, the importance of strengthening the teams with experts in a permanent basis is apparent. This might be more important in volunteer-managed sites, where one permanent member of staff could bring such useful expertise and permanency.
Provider organisations of knowledge artefacts also answered the same question on source types. Whilst internal creation was also the top source for provision, co-creation with other organisations was the second, potentially driven by partnership grant funding (Table 6 18). The low level of updated knowledge artefacts in the cultural heritage organisations, however, raises the question of how the providers maintain the created knowledge artefacts, especially once a partnership grant funding has ended. Specific commissioning was a relatively low option, implying that each provider organisation or partnership had in-house expertise for creating the knowledge artefacts, which was partly contradicted by the interviews. Perhaps reviewing the development of knowledge artefacts could improve the uptake of the almost-ready option by users?
The provider organisations contributed information on their knowledge artefact processes (Table 6 19). Nearly all their knowledge artefacts were accessible online, although a third were not searchable by type of operation. Most provider organisations believed that their knowledge artefacts were easy to use and adapt. Most of these organisations did not know how much their knowledge artefacts had been used, although three-in-four had feedback processes for finding user views and needs.
Having explored sources and external access to knowledge artefacts, the final aspect to investigate is the internal access to the knowledge artefacts that a site has created or otherwise sourced. This can potentially amplify or reduce the impact of the present and updated knowledge artefacts of a site.
Participants were asked: whether people in their organisation had access per-missions to knowledge artefacts, whether they could find what knowledge artefacts the organisation and their site had (list/ register), and whether they had access (online and physical, time allowed, accessible formats etc.). Data was filtered automatically for multisite and single site participants. In multisite organisations, providing access permission to all relevant knowledge artefacts related to 31% increase in presence, 14% increase in updated knowledge artefacts, and 21% increase in performance. The colours in Table 6 20 make these patterns obvious; the presence, updating, and per-formance improved from below average (red in left hand side) to above average (in green) when they provided permission access to knowledge artefacts. Additionally, being able to find what knowledge the organisation or site had, related to increases, although less significant ones. Accessibility also related to increase in all three, at a rate in between the permission and finding ones. In all questions, performance was below average with limited access, and above average with access.
In single site organisations the variation between limited and full access to knowledge artefacts was even more obvious (below average levels in red dominate the No columns, whilst above average levels in green dominate the Yes columns) (Table 6 21). Every objective had below average presence, updating, and performance when relat-ed to limited access (red on left hand side). Access related to significant knowledge artefact and performance increase in all objectives: giving access permissions related to 17% increase in performance, being able to find what is available related to 25% increase in performance, and ensuring accessibility to knowledge artefacts related to increased performance by 21%.
Table 6 22 shows the total sites, combining multisite and single site organisations. In the right-hand side, the combined effect of per-missions, registry, and accessibility is shown. With internal access to knowledge artefacts, across all sites the presence is higher by 98%, updated knowledge artefacts up by 90%, and performance up by 26%. The pattern is stark across the cultural heritage system, performance is consistently and significantly above average when people are given access to, and information about what knowledge artefacts the organisation has.
A final examination of access was conducted, by management types. Charts were avoided as the aim was not to competitively com-pare the management systems; instead the data has been presented in tables enabling easy review of the full data and to visually show the change from below average (in red) to above average (in green) by management category. Mixed/ commercial sites are the only ones that have reduced presence of knowledge artefacts with increased permission. These more competitive organisations most likely conceal certain resources when they provide access to their depositories.
Having access permissions related to higher updating (except national institutions), and higher performance (except universities). Family/ private owner (58% increase), national institutions (58% increase), and local government sites (28% increase) showed the highest performance increases (Table 6 23).
Being able to find what knowledge artefacts the site has (Table 6 24), and improved accessibility (Table 6 25) both related to similar increases for each management type, at slightly lower rates.
A joined-up understanding of the demographic category relations to knowledge artefact characteristics and performance, are brought together in the summary section next.