Geographic categories
The presence and updated levels of knowledge artefacts for each participating country are shown in Table 5‑3. The presence and updating variance from the overall average are shown, as is the conversion rate of present to updated knowledge artefacts. The findings for countries other than Greece, New Zealand, and the United Kingdom, are based on small samples (seven or fewer) and are not discussed individually.
Countries and nations: for the three focus countries there was a modest variation across the four objectives and the overall average, with the United Kingdom having a higher presence average at 22.11% (Figure 5‑14).
Similarly, there was a modest variation across the three participating nations of the United Kingdom, with a relative consistency within each of the four objectives (Figure 5‑15).
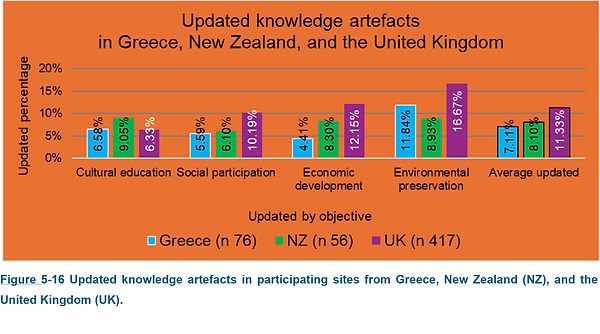
Whilst updating levels in the Cultural education objective were relatively similar across the three countries (Figure 5‑16), the United Kingdom had a significantly higher level in the other three objectives, especially in Environmental preservation driven by the collections’ standards documentation flute (as seen earlier in Table 5‑2).
The conversion rate of present to updated knowledge artefacts between Greece and New Zealand were very similar, whilst in the United Kingdom it was much higher (Figure 5‑17).
In the United Kingdom, the three participating nations had relative updating levels within each objective, with Wales and Scotland below the United Kingdom average, and England above average (Figure 5‑18).
All three UK nations are above the overall conversion average of 46.94%. England had the lowest updating rate in the United Kingdom, whilst Wales has the highest, with updated knowledge artefacts in 6 out of 10 flutes that have knowledge artefacts present (Figure 5‑19).
Comparison of knowledge artefact characteristics and performance across the three countries shows that the UK had the highest volume of present and updated knowledge artefacts, and the highest rate of conversion, but not the highest performance (Figure 5‑20).
Within the UK, England had the highest presence and the highest updated level too, however, the conversion rate was the lowest, so the high presence was not utilised. Furthermore, the highest updated rate in England matched the lowest performance. It therefore appears that the high volumes being produced in England were not updated and were not as effective as the ones produced in Scotland or Wales. Wales had much fewer present, but almost as many updated and seemingly more effective knowledge artefacts (Figure 5‑21).
Comparing the performance of the four objectives, Economic development had consistently the lowest performance across these countries and nations (Figure 5‑22).
Regional level: the presence of knowledge artefacts across local, national and international sites was quite similar, but regional sites had a much lower rate at 17.18% (Figure 5‑23).
In Figure 5‑23 it is noticeable that local sites, which tend to be privately owned or independent, had a decreasing presence of knowledge artefacts towards the tangible operations, whilst regional sites, which tend to be part of local authority or other parent organisations, had a decreasing volume towards the intangible operations (Figure 5‑24).
A similar pattern was observed in the levels of updated knowledge artefacts across the four geographical rankings, with much lower levels at regional sites. The higher volumes by national sites are clearly exaggerated due the Environmental preservation (conservation knowledge artefacts), rather than the cultural, social, or economic objectives (Figure 5‑25).
Local sites had the highest presence, coupled with above average conversion to updated, and the highest performance. Regional and national sites had similar levels of conversion, but the initial higher presence in national sites relates to higher performance (Figure 5‑26).
The highest performance seen by local sites can probably be explained because they had the most uniform performance across the four objectives. Economic development, as in all countries and nations, had the lowest performance across all geographical rankings (Figure 5‑27).