Headline characteristics and performance findings
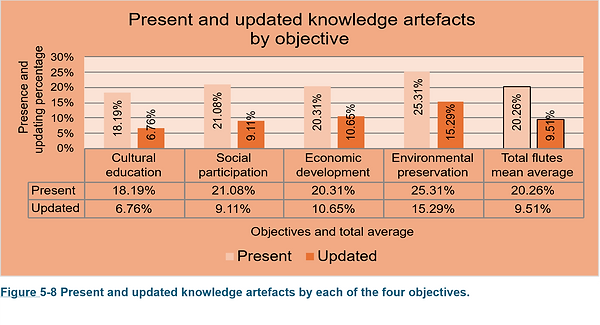
The presence of knowledge artefacts was surveyed across 51 suboperations (flutes) representing all 16 operational drums within the four organisational sustainability objectives. 561 subject specialisms were managed by the 244 participants, giving a total potential presence of knowledge artefacts in flutes of 28,611 (561 subject specialisms x 51 flutes). The total actual presence was 5,797, representing a 20.26% presence (5.797/28,611), so roughly one in five operational flutes only had knowledge artefacts present. Knowledge artefacts that were updated or created within the previous 12 months were reported as up-to-date. A total of 2,720 flutes had updated knowledge artefacts, being 9.51% of the total operational flutes. So, across all the participants, roughly one-in-ten flutes had up-to-date knowledge artefacts (Figure 5 7).
The presence for each of the four cultural heritage objectives was obtained by combining their flutes. As these objectives have different numbers of flutes, their mean average was calculated to give each objective equal weighting. So, the total (51) flutes’ presence average of 20.26% is statistically correct (5.797/28,611=20.26%). This is not the same as the average of the presence in the four equally weighted objectives (18.19% + 21.08% + 20.31% + 25.31% = 21.22%), (Figure 5 8) which would be an average of averages and statistically inaccurate (Indi-ana Business Research Center, 2013). Cultural education had the lowest presence (18.19%), followed by Economic development (20.31%), Social Participation (21.08%) and peaked with the Environmental preservation (25.51%), which also had the largest rate of updated knowledge artefacts (Figure 5 8).
It is worth remembering that the four objectives have purposefully been positioned with the more intangible socio-cultural science objectives together on the left-hand side (curation of cultural and social diversity), the socio-economic objectives in the middle, and the more tangible natural science objectives (curation of collections, buildings, historic environment, and biological diversity) together on the right-hand side. A clear continuous increase of present and of updated knowledge artefacts is observed (Figure 5 8) from the lower volumes in intangible operations towards the tangible operations to the right. Perhaps statements of significance are more difficult to create and update than collections policies. Or the priorities are higher for the legal requirements within the Social participation rather than Cultural education, and even higher within Economic development (for example governance documents) and Environmental preservation (such as listed buildings documentation requirements).
The rate of conversion of present to updated knowledge artefacts has the same increase from the intangible to the tangible operations, as clearly seen in Figure 5 9. The total updated knowledge artefacts (9.51%) represent a conversion of 46.94% of the present knowledge artefacts (20.26%), so just under half of all the present knowledge artefacts had been updated.
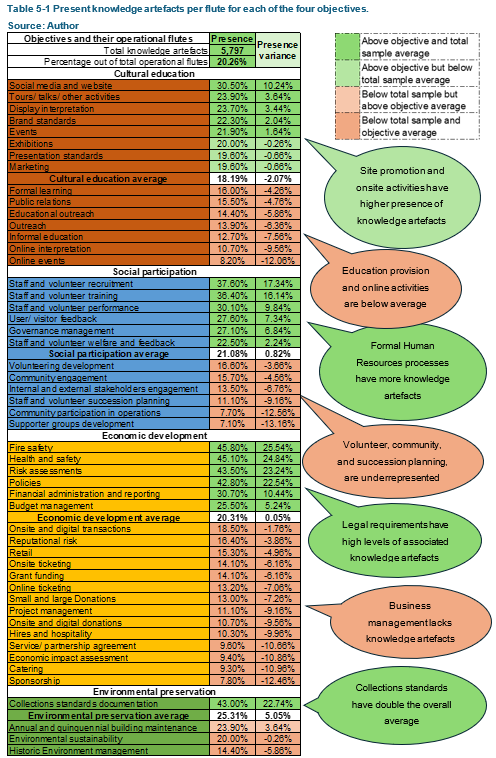
Environmental preservation not only had the most operational flutes with present knowledge artefacts, but also the most updated ones (60.39%), whilst Cultural education had the least updated. Legal requirements such as human resources management, and Health and Safety have high presence and relatively high updating levels. Collections documentation management, associated with accreditation, has similarly high levels of present and updated knowledge artefacts. The present (Table 5 1) and updated (Table 5 2) knowledge flutes for each objective are shown with accompanying commentary.
Performance relation
There is a positive relation between presence of knowledge artefacts and perfor-mance. As seen in the scatterplot (Figure 5 10) there are increasing values in the y axis (performance) when x values (presence) increase. As shown in the same Figure 5 10, and in Table 3 8, the performance constant (B) is 47.93, so the performance with no knowledge artefacts present, is 47.93% (just below the 50% average on the Likert scale used in the survey). The increase in performance (b) is 0.59% (Figure 5 10 and Table 3 8) for every flute with present knowledge artefacts. Based on the linear regression equation (y=B + b * x), with presence in 10 of the 51 operational flutes (x=10) the performance will be (47.93%+0.59%x10=) 53.83%, with presence in 20 of the operational flutes the performance will be (47.93%+0.59%x20=) 59.73%, and so on.
A similar positive relation was found with the updated rates (Figure 5 11). The performance constant (B) in relation to updated knowledge artefacts is higher than having just present knowledge artefacts, at 50.54% and the increase step (b) is larger too at 0.80%. This means that performance with updated knowledge artefacts starts at a higher level and increases faster, so with updated knowledge artefacts in 10 of the 51 operational flutes (x=10) the performance will be (50.54%+0.80%x10=) 58.54%, with updated knowledge artefacts in 20 of the operational flutes the perfor-mance will be (50.54%+0.80%x20=) 64.54%, and so on.
The p value for both relations is p < 0.001 (Table 3 8), so statistically the relations are highly valid. The performance with no presence of knowledge artefacts, no updated knowledge artefacts, and with the current levels, is summarised in Figure 5 12.
Across the full sample therefore, performance with no presence of knowledge arte-facts is 47.93%, with no updated knowledge artefacts is 50.54%, and with the current levels of present and updated knowledge artefacts the performance is 54.97%. This is a performance increase by 15% (54.97-47.93/47.93), similar to the 17% (68.6-58.4/58.4) increase observed in the pilot (section 5.1).
The performance levels reflect the presence and updating levels across the objec-tives, apart from Cultural Education, which appears less dependent, but also has a low conversion rate of present to updated (Figure 5 13).
#
The rate of presence, of updated knowledge artefacts, and associated performance vary across the demographic categories of the 561 included sites or departments. Different types of management and different operations have variable relation to the ob-jectives, and each objective has its own disposition. These variations by category are explored next.